Documentation
On this page you will find general information regarding the challenge and specific documentation about the dataset format provided for the model training.
Description
In recent times, weather data collection devices predominantly rely on mechanical sensors. However, these solutions possess certain drawbacks that could be addressed by adopting a non-mechanical alternative, one that guarantees low power consumption and seamless integration into embedded systems or IoT networks. Such a solution holds great promise for industries like agriculture, aeronautics, and maritime navigation, where accurate weather data plays a crucial role.
With this in mind, our challenge is to develop an advanced machine learning algorithm capable of predicting weather patterns based on microphone recordings and TPH data, without the need for mechanical sensors. Your role will involve designing and training a model using the provided data. The objective is to replace traditional mechanical rain and wind sensors with a microphone-based system.
To build upon our initial prototype, which successfully classified rain and wind speed into two categories (refer to the linked paper), we now invite you to surpass our achievements and create an even more accurate and robust model. Together, we can revolutionize weather data collection and make a significant impact on various industries.
Dataset overview
Several stations have been installed to gather data, which collectively constitutes the final dataset. Each sample collected respects a specific binary format occupying a defined number of bytes. The data within each sample or packet is possess exactly 49196 bytes structured as follows:
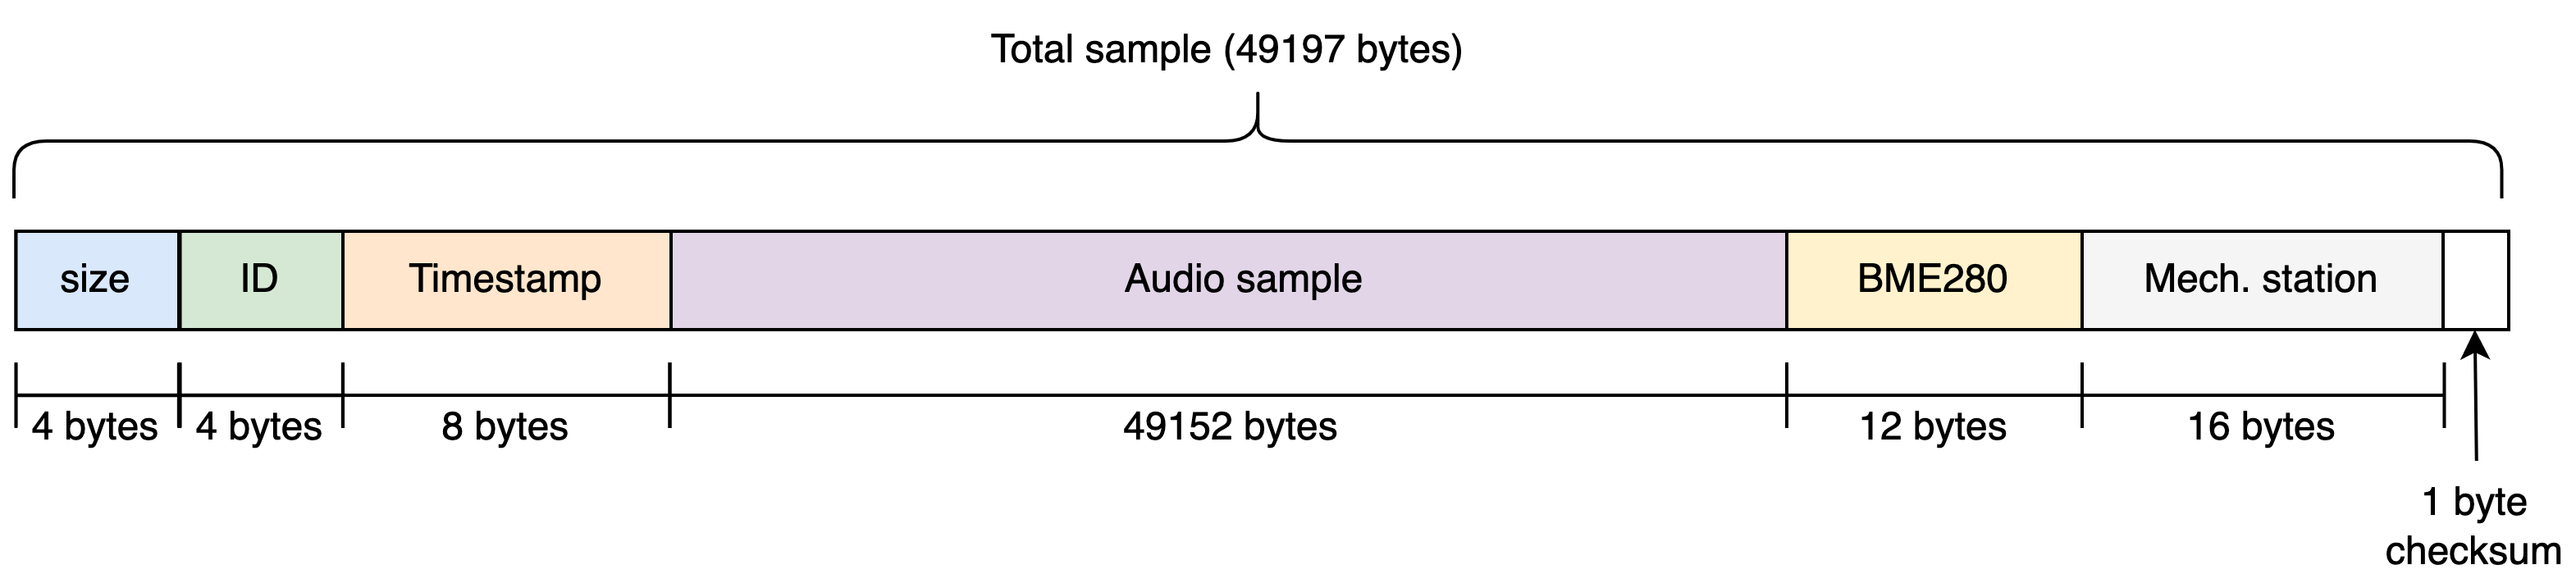
Packet size (4 bytes)
This piece of information indicates the number of bytes used for the current sample. It plays a role in
distinguishing between potential different data formats, allowing for flexibility in case of future updates.
The packet size for each sample is encoded over 4 bytes using a C++ size_t type.
Packet's ID (4 bytes)
Each sample is assigned a unique ID in sequential order by its respective station independently to
the other stations. Consequently, different stations may assign the same ID to different samples.
To differentiate between sample 1 of station 1 and sample 1 of station 2, additional guidelines will
be provided later in the documentation. The packet ID is encoded over 4 bytes with a C++ uint32_t type.
Timestamp (8 bytes)
A timestamp in Unix milliseconds format accompanies each sample. The timestamp is encoded over 8 bytes using a C++ unsigned long long type. It is important to note that the timestamp is fixed just before the sensors' data acquisition.
Microphone data (49152 bytes)
Data acquisition starts with the microphone (SPH0645), employing the I2S communication protocol with specific specifications:
- Audio sampling frequency: 16384 Hz
- Audio sample size: 3 bytes
- Number of channels: 1 (left channel)
Each sample comprises one second of audio recording, resulting in an encoded data size of 49152 bytes.
BME280 data (16 bytes)
Alongside microphone data, the device records, in this exact order the temperature in ˙C, pressure in Pa,
approximate altitude in m, and relative humidity in percent using a BME280 sensor. Each value is encoded
over 4 bytes with a C++ float type, making the BME280 data a total of 16 bytes.
Mechanical station data (12 bytes)
This data serves as the ground truth for training the model and should not be included as an input in the final model.
The mechanical station records rain_count, wind_count, and wind_direction in this specific order. Each value is
encoded over 4 bytes with a C++ uint32_t type, resulting in a total data length of 12 bytes.
The rain_count indicates the number of interrupts generated by the rain gauge since the last polling of mechanical data. According to the documentation, the rain gauge's interrupt occurs for every 0.2794mm of rain. Please be aware that certain microphone samples may capture the sound of the rain gauge bucket flipping, which could potentially impact your model training.
The wind_count represents the number of interrupts generated by the anemometer since the last polling of mechanical data. The anemometer's interrupt occurs once per second for a wind speed of 2.4km/h.
The wind_direction is measured with the MCU's ADC, following the procedure specified in the documentation. The value lies within the range of 0 to 4096, and a decoding script is provided to interpret this information. (check out the python script here)
-
CSEMAurora1is associated with mechanical stationstation1
Additional details about the mechanical station can be found in the documentation.
Checksum (1 byte)
On August 9 2023, a checksum byte was implemented for monitoring data integrity and detecting transmission errors. While participants need not be overly concerned about this change, it's worth noting that the total data size will now be 49197 instead of 49196. The algorithm used is a CRC-8 from byte array inspired from this website.
Files' structure
The dataset comprises binary files in .dat format, each representing the recorded sample by a specific station during one hour.
The naming convention for these files is as follows, with <name> representing the station's name:
raw_data_<name>_<date in YYY-MM-DD>_<hour>.dat
For instance, a file named raw_data_station1_2023-08-04_18.dat would contain data collected by "station1"
between 18:00 and 19:00 on the 4th of August 2023. It's important to note that, as explained earlier in
the packet's ID section, both raw_data_station1_2023-08-04_18.dat and raw_data_station2_2023-08-04_17.dat
may contain a sample with the same ID, since each station independently assigns the IDs.
To facilitate data management, .zip files are made available.
These zip files contain data collected by one station during one week. These files can be accessed through
the website's dataset page.
Discussion
In this section, we will expose challenges that you might encounter if you decide to use the dataset available on this website.
Determining the precise rain intensity at any given time is challenging due to the inherent nature of the rain gauge mechanism. It provides intermittent information, triggering interruptions each time it reaches its full water capacity. Consequently, the duration between two interruptions correlates with the average intensity within that time interval. The elongation of this time gap can result in a high uncertainty regarding the rain intensity. To illustrate, the figure below showcases three distinct rain intensity profiles that could have triggered the same interruptions (depicted in the background).
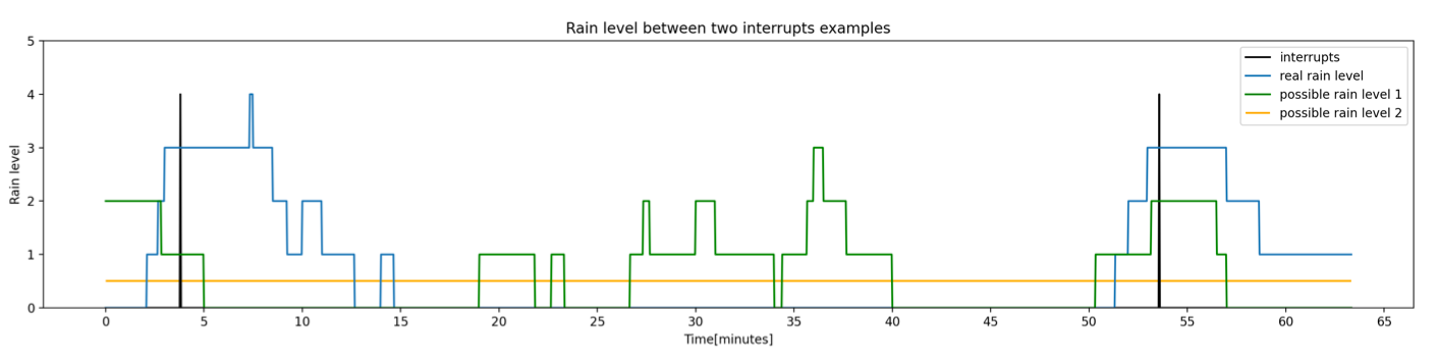
At this stage of the challenge, your role will be to find a way to convert the interrupts into rain profiles that represent accurately the real rain intensity or find techniques to reduce uncertainty.